Montenegro housing, read closely
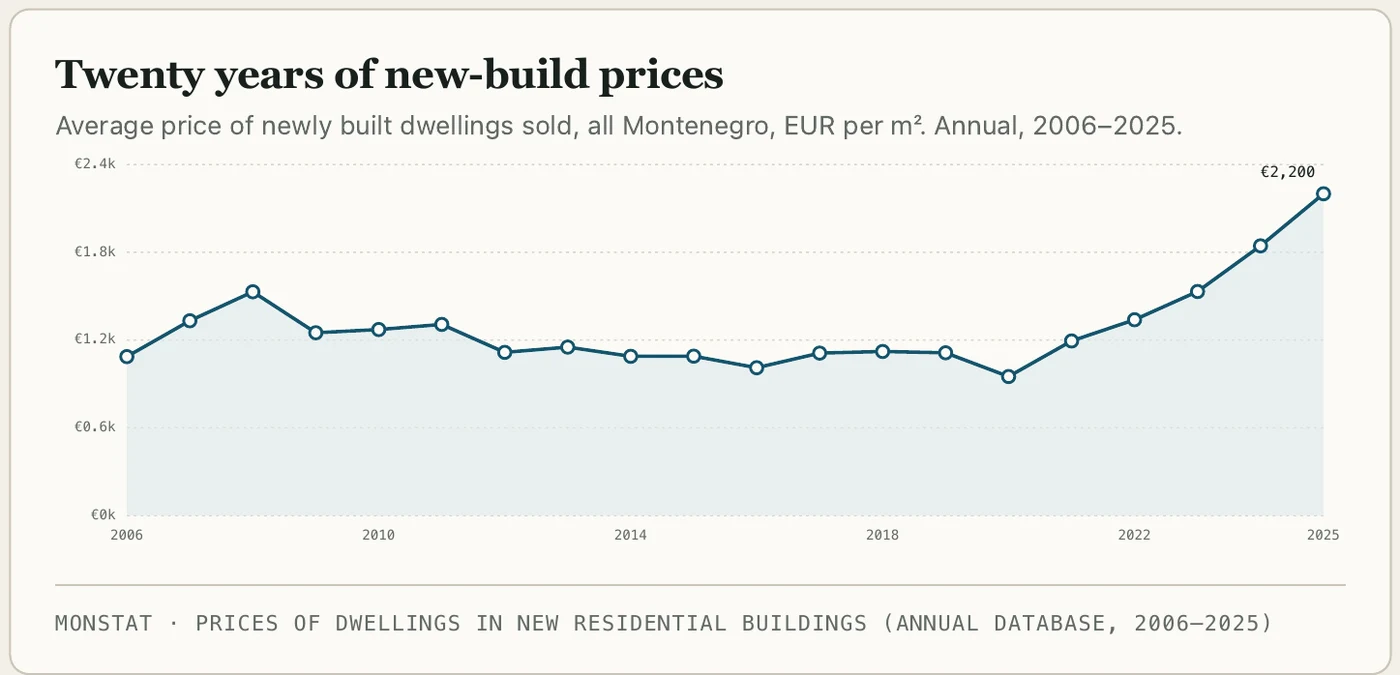
MONSTAT's average price of newly built dwellings reached €2,200/m² across Montenegro in 2025, and €2,557/m² in the second quarter of 2026. The coast leads at €2,838/m² this quarter; the interior is climbing from a much lower base.
Updated 23 August 2026 · Data through Q2 2026 · Sources: MONSTAT, CBCG
Read this first
MONSTAT is a statistics office, not a cadastre. Its price series is the average price of new dwellings sold for the first time, computed from concluded purchase contracts, at region level only. There is no official per-complex price and no all-market transaction count, because Montenegro's cadastre does not publish a transaction-market report (a price register was announced in 2019 but is not public). Total euros sold is not published directly either - but the buyer's transfer tax lets me recover the resale half of the market, and that is done in section 05. Every number here is labelled by source. What the data cannot show is said plainly rather than filled in.
New-build prices rose 19% in a year
Headline figures from MONSTAT's new-build series. These describe the typical new dwelling sold for the first time, not any specific project.
Full-year 2025 average
€2,200/m²
New-build, all Montenegro
Year on year
+19.3%
2025 vs 2024 (€1,844)
Coastal region 2025
€2,412/m²
Highest region - +18.9% YoY
Latest quarter
€2,557/m²
Q2 2026 - preliminary
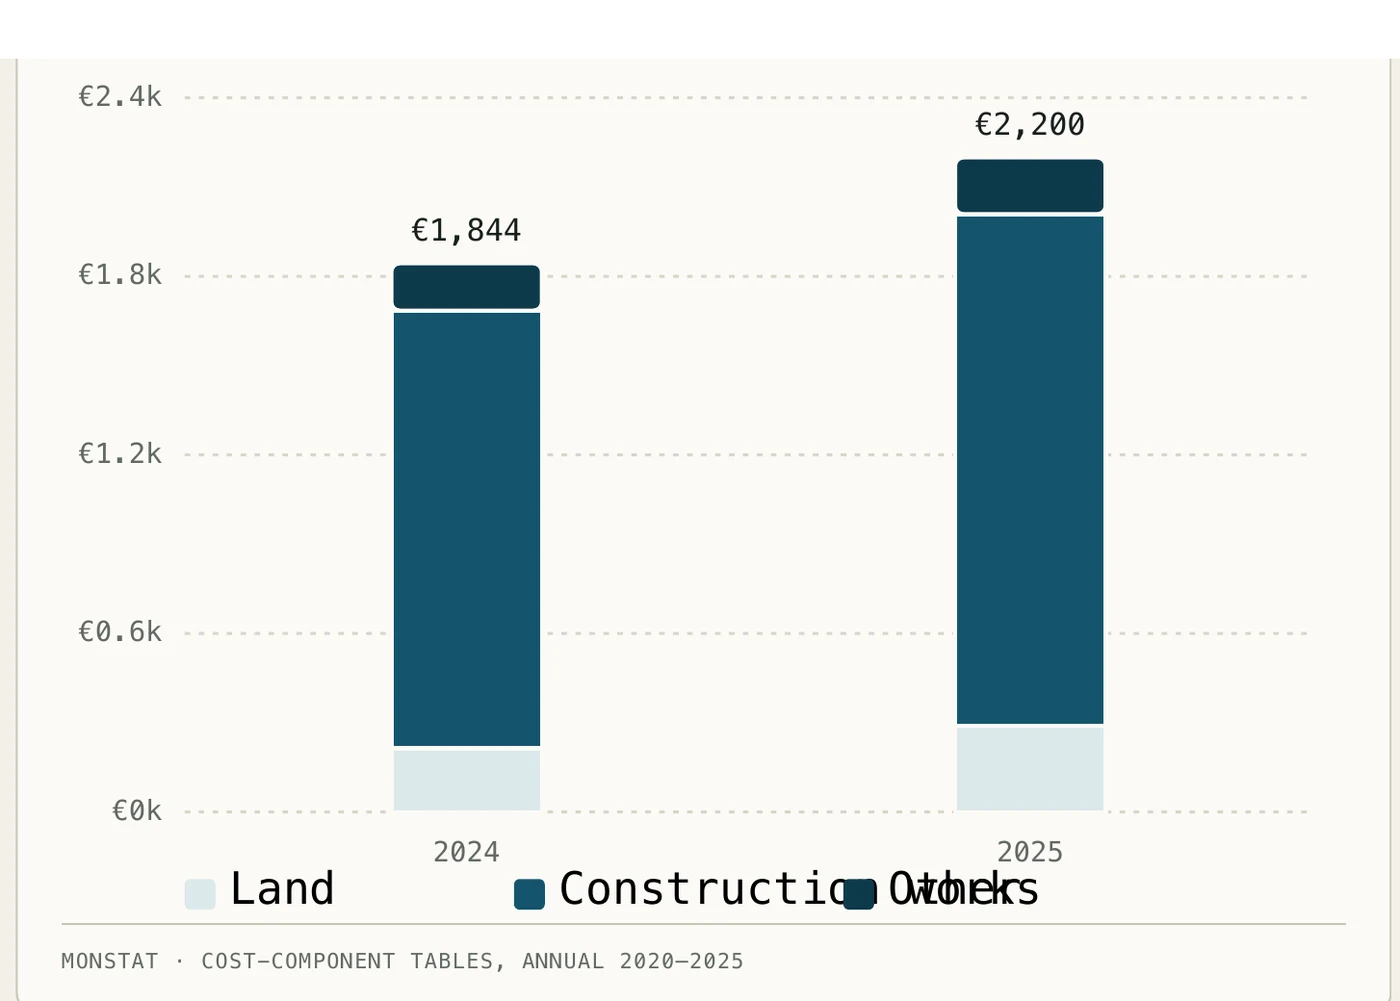
What you pay for
Price decomposition, EUR per m², all Montenegro. Land arrangement, construction works, and other costs.
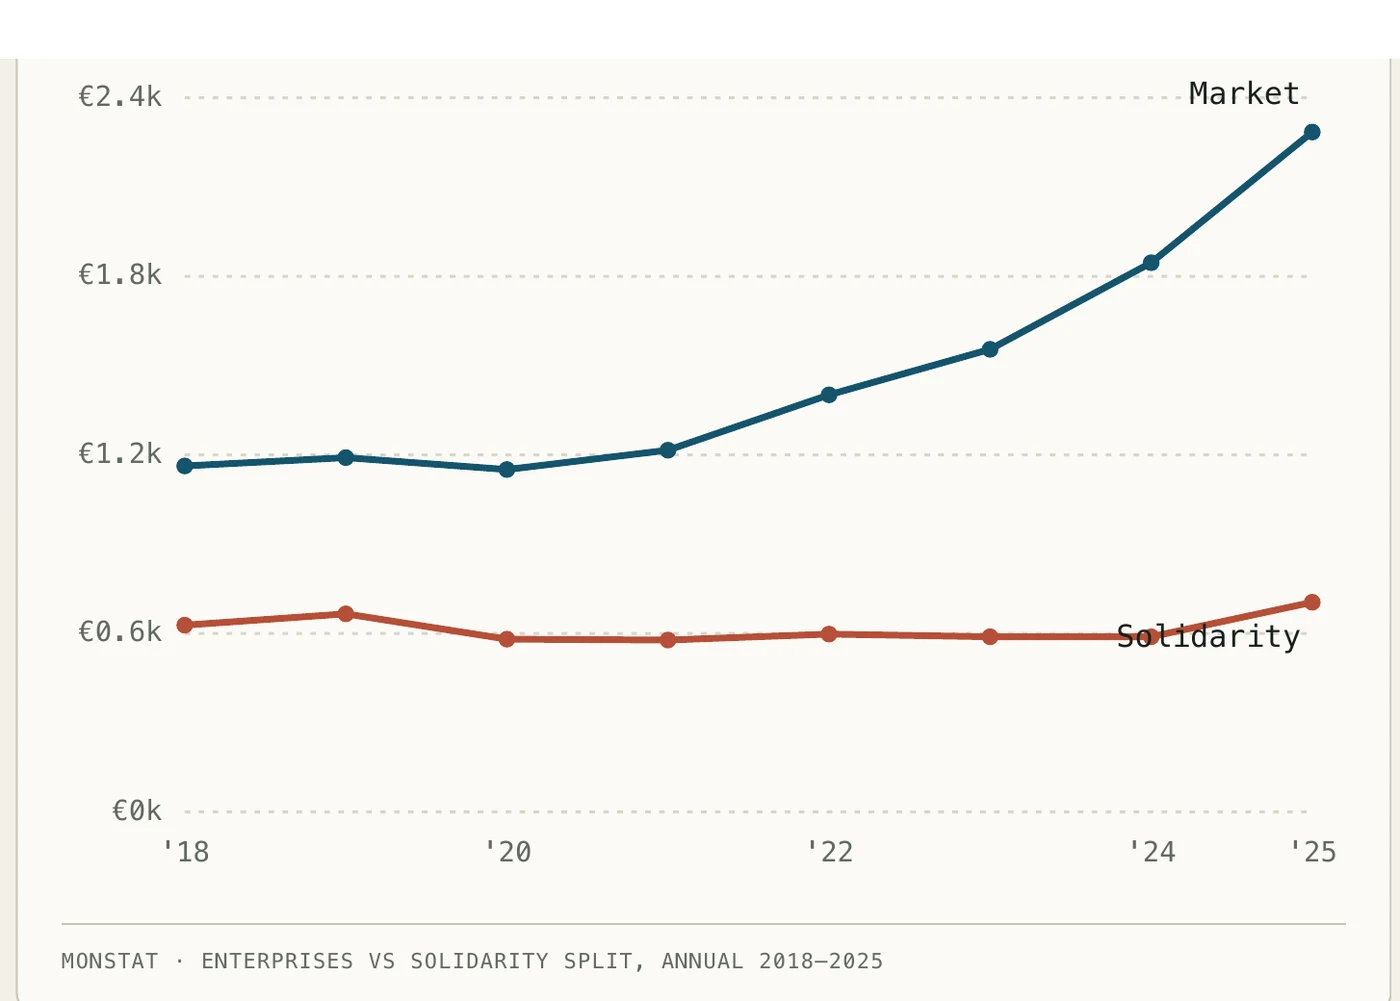
Market vs solidarity housing
The national average blends open-market sales by enterprises with subsidised solidarity housing. EUR per m², annual.
The coast sets the price. The rest is a different market.
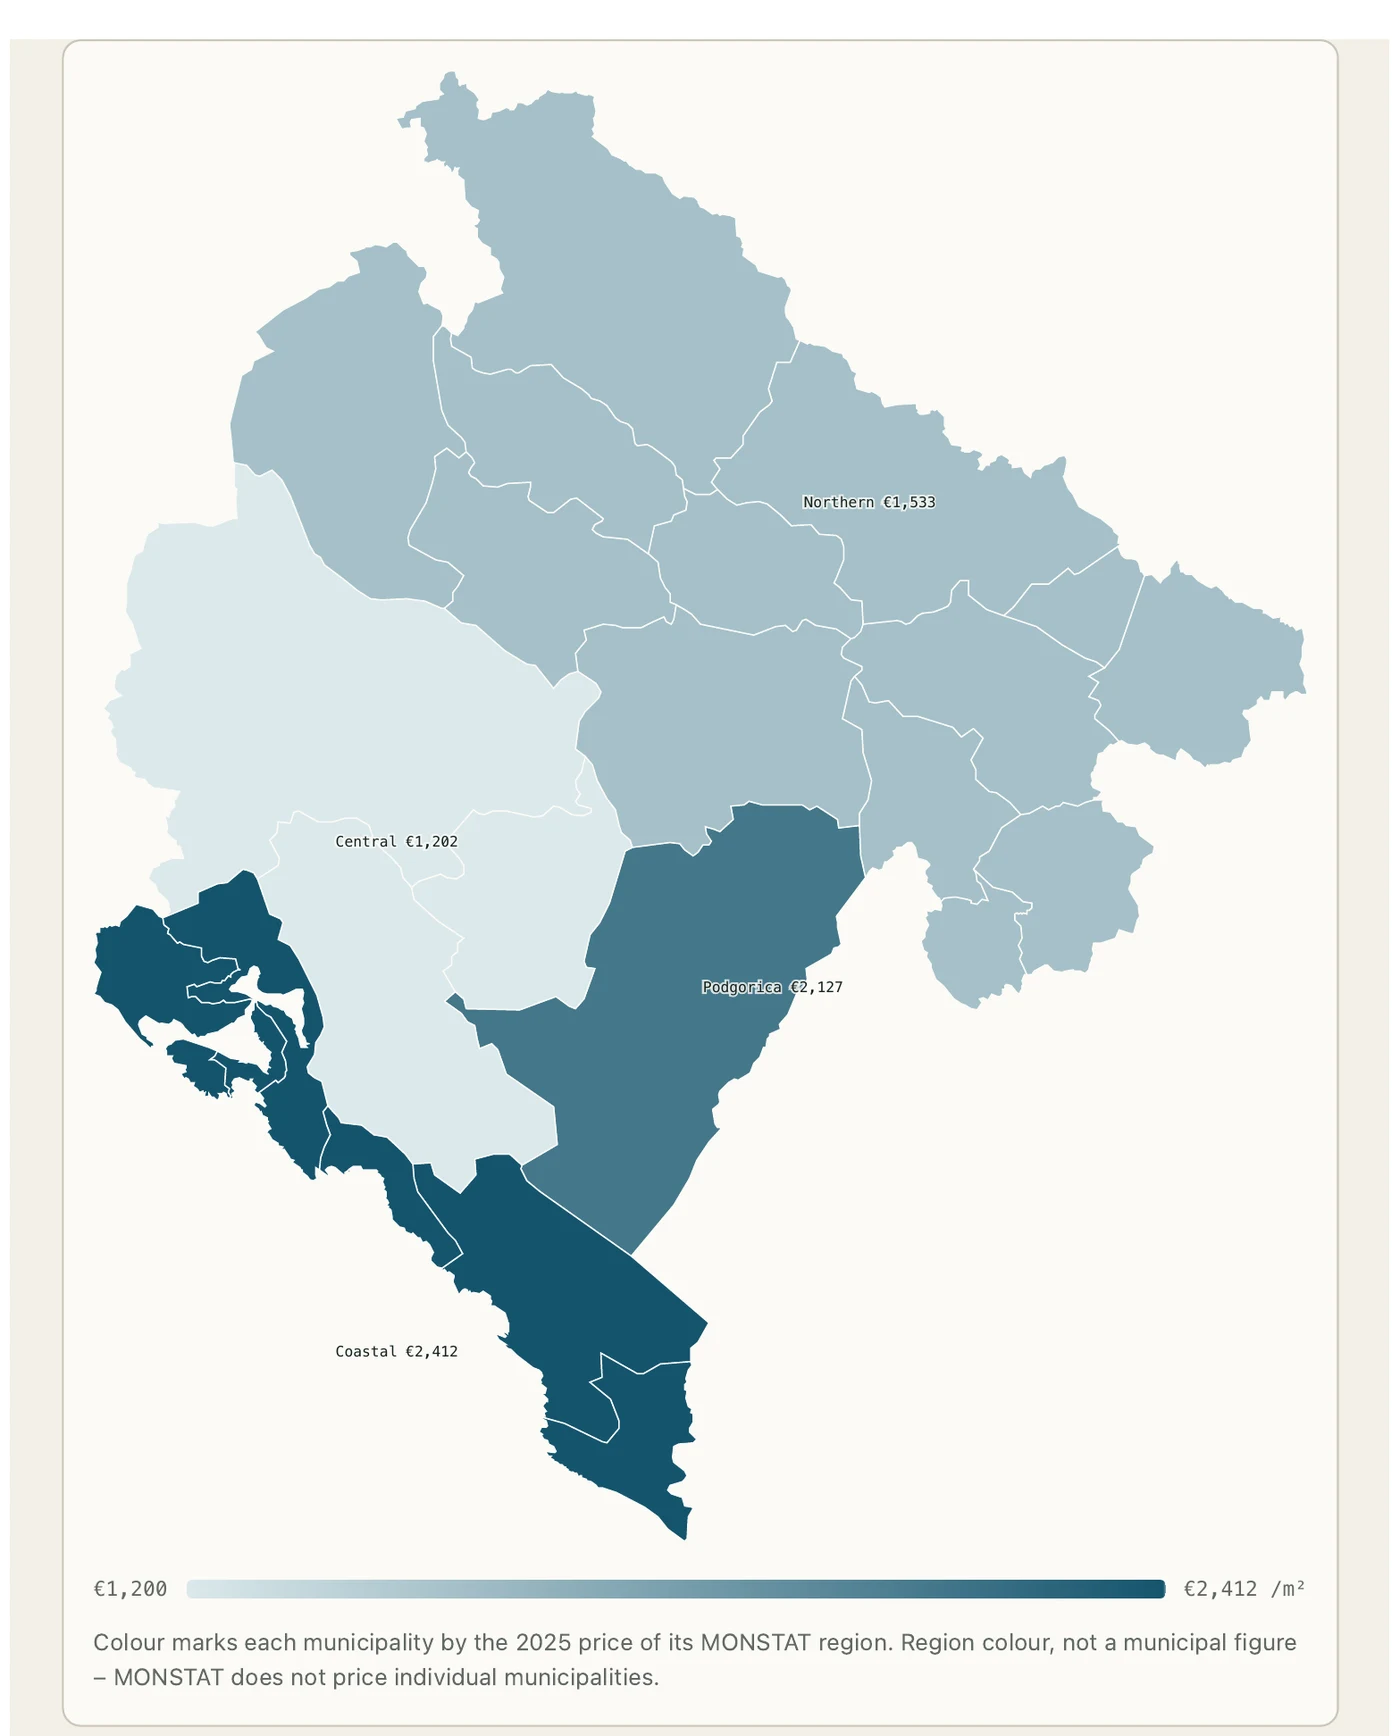
MONSTAT reports four areas: Podgorica on its own, and the Coastal, Central and Northern regions. That is the finest geography that exists officially. There is no municipality-level or per-project price in this series.
Where the price sits on the map
Colour marks each municipality by the 2025 price of its MONSTAT region. Region colour, not a municipal figure - MONSTAT does not price individual municipalities.
Coastal
Bar - Budva - Herceg Novi - Kotor - Tivat - Ulcinj
€2,412
+18.9% YoY
Podgorica
Capital, reported on its own
€2,127
+17.5% YoY
Northern
13 inland municipalities incl. Bijelo Polje, Pljevlja, Kolašin, Žabljak
€1,533
+17.4% YoY
Central
Cetinje - Danilovgrad - Nikšić - Tuzi - Zeta
€1,202
+27.2% YoY
Regions since 2017
Average new-build price by region, EUR per m², annual 2017-2025. The gap between the coast and the interior is the whole story.
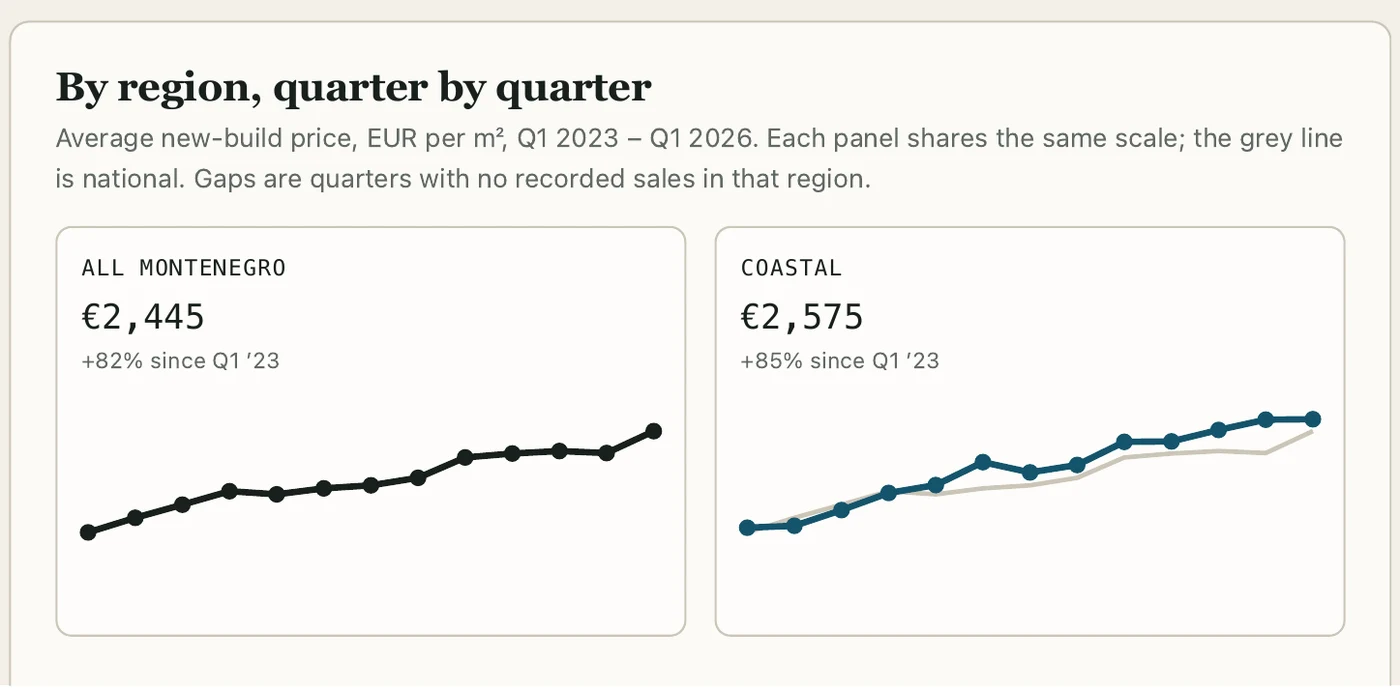
Latest quarter, by area
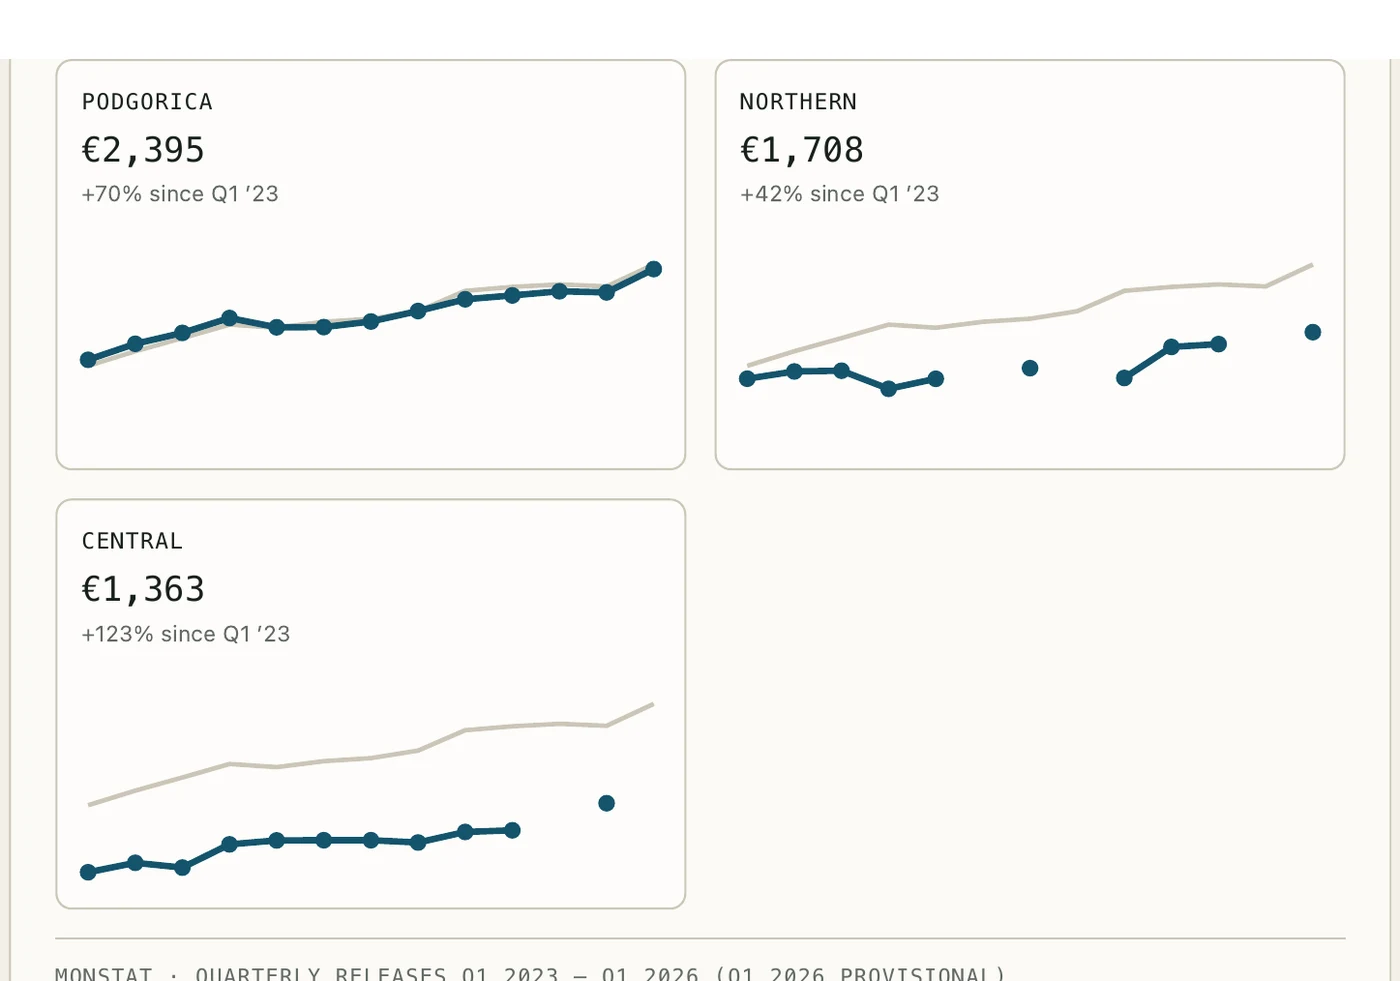
Average new-build price, Q2 2026 (preliminary), with change on the previous quarter. MONSTAT reports no solidarity-housing sales in Q2 2026, so the average is pure market price. The Central region recorded no sales in Q1 2026, so it has no quarterly comparison.
All Montenegro
€2,557
+4.6% vs Q1 2026
Coastal
€2,838
+10.2% vs Q1 2026
Podgorica
€2,510
+4.8% vs Q1 2026
Northern
€2,145
+25.6% vs Q1 2026
Central
€2,131
no sales in Q1 2026
Region prices in full
Average new-build price by region, EUR per m², annual 2017-2025. The regional split begins in 2017. 2024 regional values are derived from the published 2025 levels and their year-on-year change; 2025 is the MONSTAT full-year average.
| Region | 2017 | 2018 | 2019 | 2020 | 2021 | 2022 | 2023 | 2024 | 2025 |
|---|---|---|---|---|---|---|---|---|---|
| All Montenegro | €1,111 | €1,122 | €1,113 | €951 | €1,194 | €1,339 | €1,532 | €1,844 | €2,200 |
| Podgorica | €1,123 | €1,054 | €1,066 | €966 | €1,211 | €1,383 | €1,585 | €1,810 | €2,127 |
| Coastal | €1,159 | €1,397 | €1,401 | €1,348 | €1,359 | €1,315 | €1,577 | €2,029 | €2,412 |
| Central | €550 | €580 | €663 | €554 | €624 | €647 | €696 | €945 | €1,202 |
| Northern | €639 | €753 | €760 | €720 | €1,060 | €1,025 | €1,220 | €1,306 | €1,533 |
MONSTAT · Prices of dwellings in new residential buildings, regional series
Supply, not sales
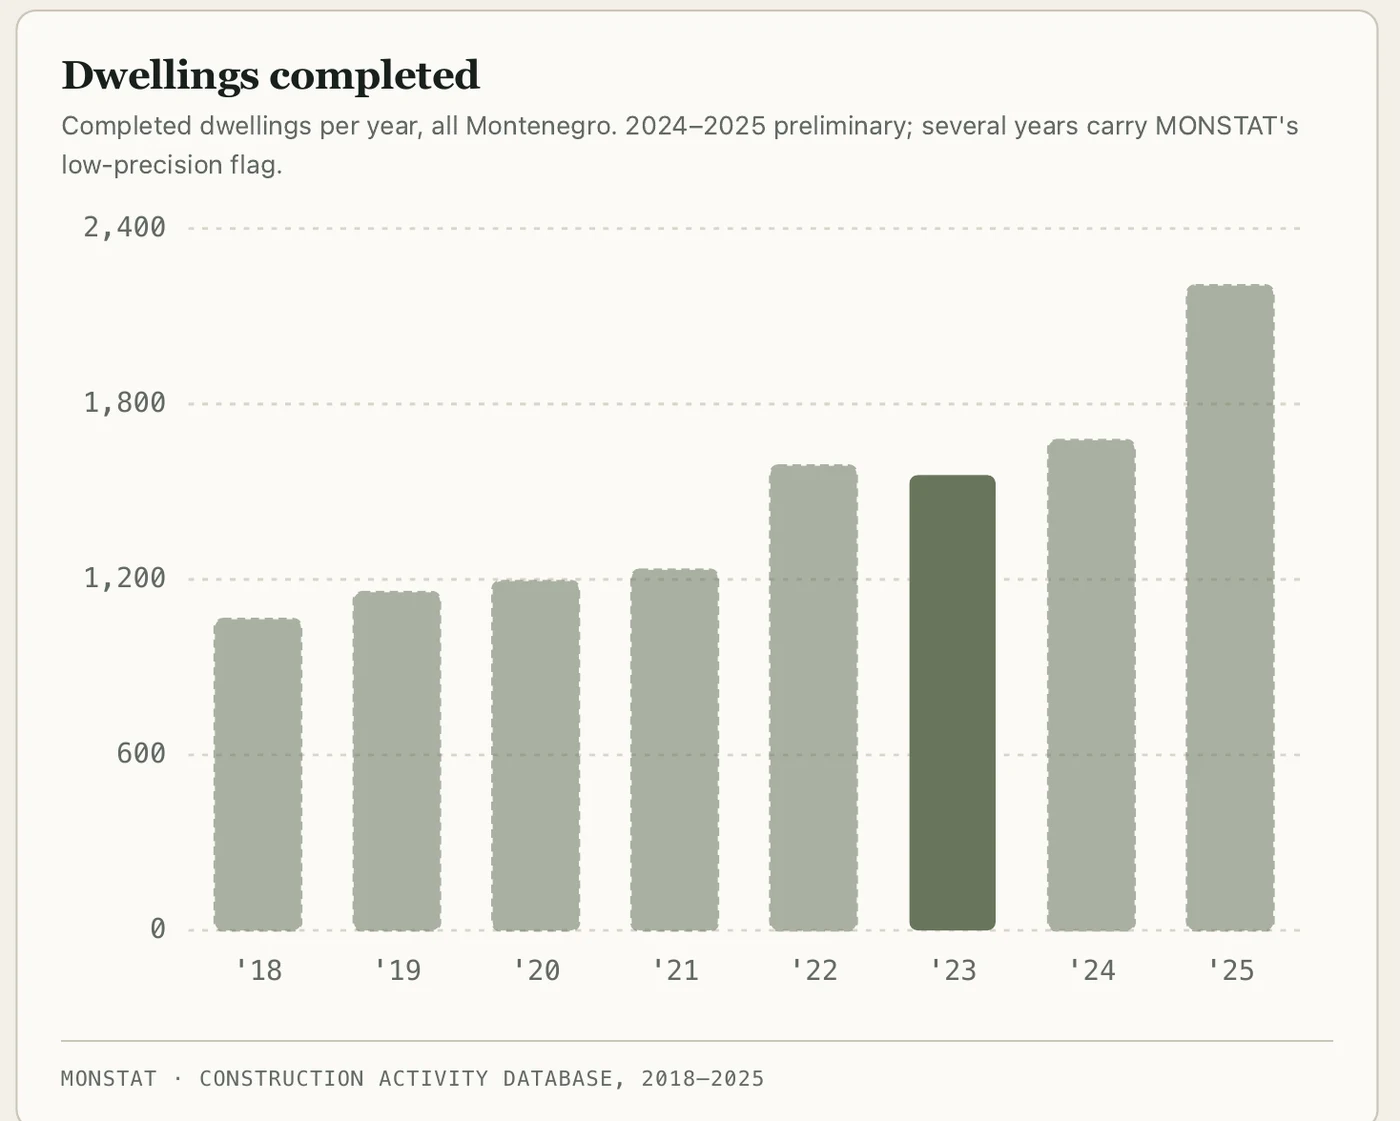
MONSTAT counts what gets built and permitted, not what changes hands. Read these as construction pipeline, not demand. Completed dwellings, building permits and the value of construction works are published nationally only, with no regional breakdown.
Completed dwellings 2023
1,557
Final figure - all Montenegro
Completed dwellings 2024
1,676
Preliminary - MONSTAT low-precision flag on several years
Permits series break
2018
Source and definition change - pre-2018 not comparable
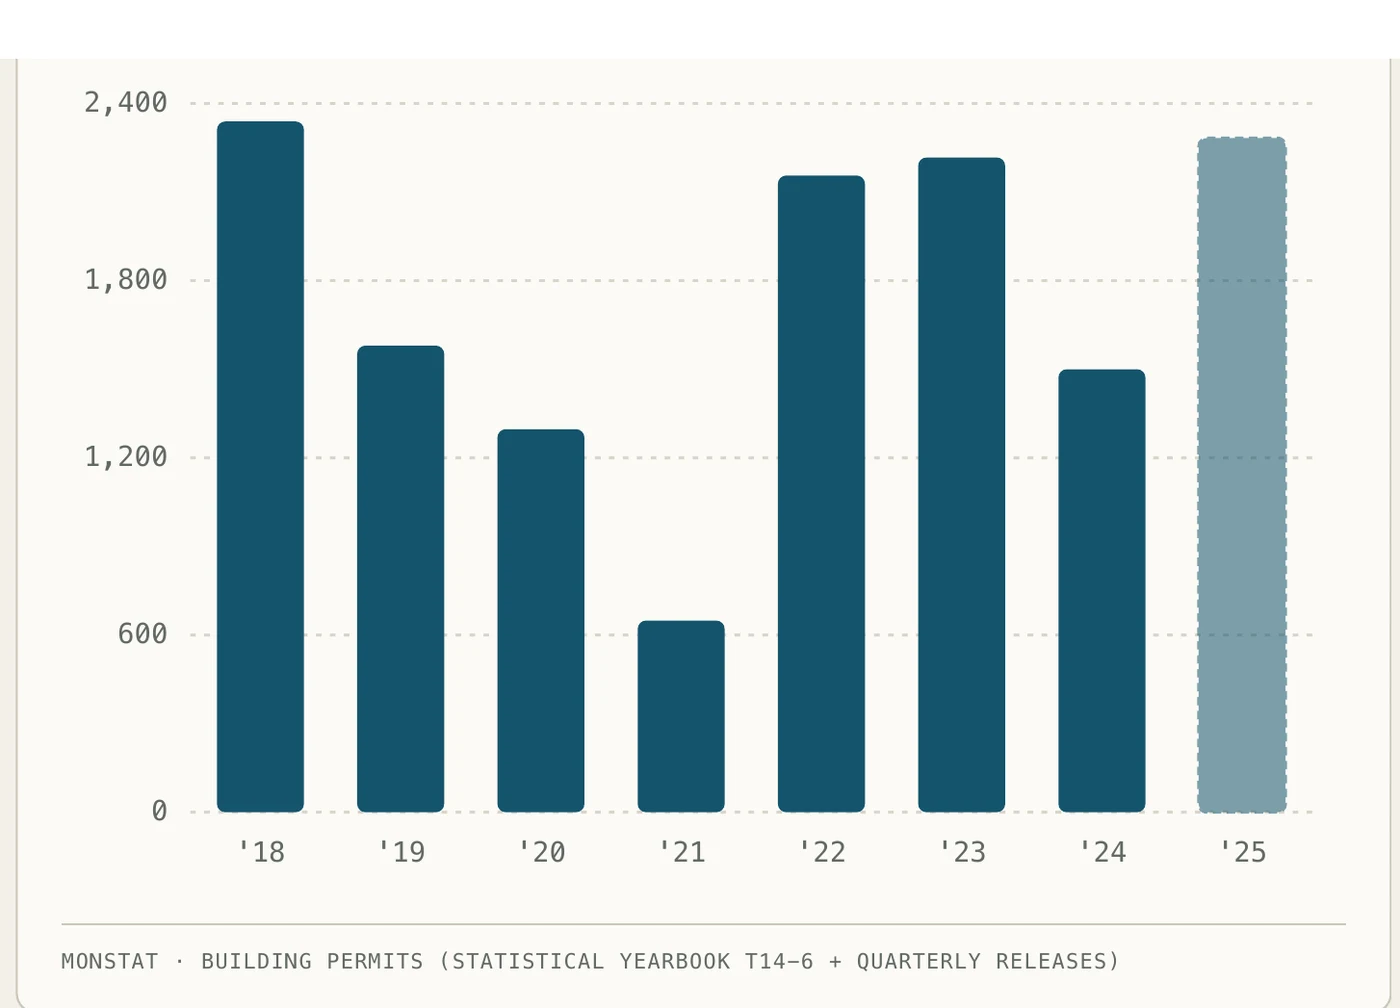
Building permits and dwellings
Dwellings covered by building permits issued per year. A methodology break in 2018 means earlier years are not comparable; 2025 sums four provisional quarters.
Value of construction works put in place
Total value of executed construction works by business companies, EUR million, buildings and civil engineering combined. Activity value, distinct from the price and permit series above.
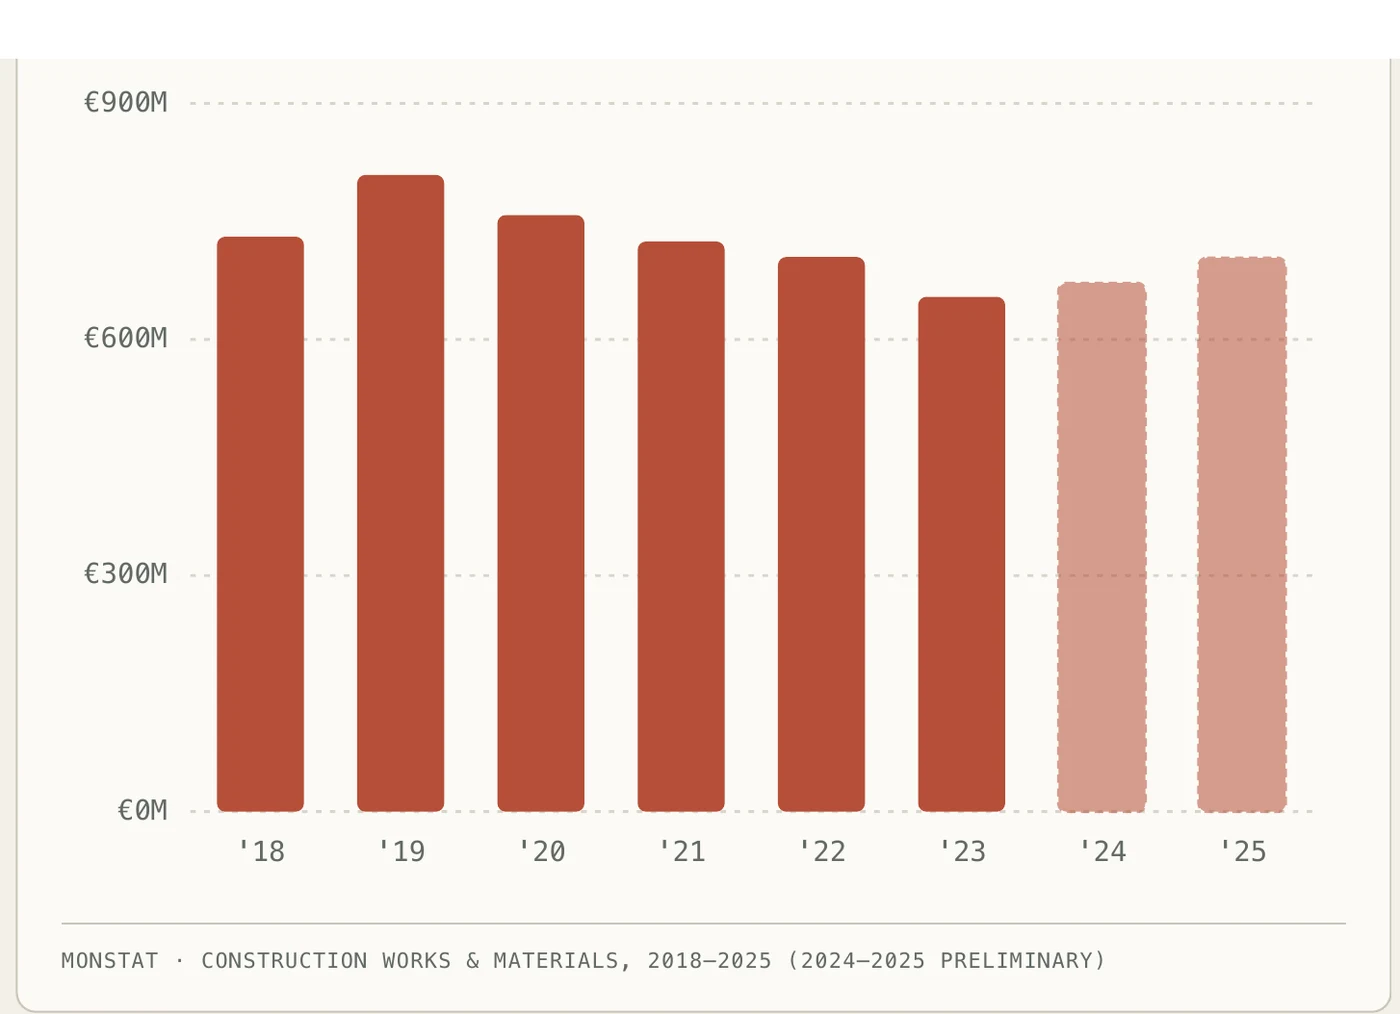
The value of construction works put in place is reported separately as activity value by business companies, covering buildings and civil engineering combined. First-half 2025 permits were anomalously low - 10 permits in Q2 2025 was a series record low - then activity jumped in the second half. The 2025 total sums four provisional quarterly releases and is not yet an official annual figure.
Who is borrowing to buy
Montenegro has no published loan share per transaction. What exists is the central bank's lender-side view: how much housing credit is outstanding, how fast it grows, and at what rate. Context, not a like-for-like.
Housing-loan stock
€579M
Households - Aug 2023 (last clean point)
Growth
+21.5%
Housing loans, y/y - May 2026
New housing lending 2025
>€210M
21.4% of new household credit
Rate on new loans
~4.8%
Nominal - ~5.1% effective - Jun 2026
Cash loans, not mortgages, dominate new household borrowing in Montenegro - about 60% of new lending in 2025. Housing is roughly a fifth. The absolute housing-loan stock for 2026 is not cleanly quoted in public sources; the €579M point is August 2023, with growth confirmed since.
How much property actually changes hands? No one publishes it.
The idea is sound: the buyer pays a transfer tax on every second-hand sale, so revenue divided by the rate would recover the value that changed hands. The problem is the input. Montenegro does not publish one reliable national figure for this tax - it is roughly 80% a municipal revenue spread across 25 local budgets, and the state-level figures that do exist do not reconcile. So no national turnover total is asserted here.
The transfer-tax rate
Porez na promet nepokretnosti. Applies to existing-property transfers; new-build first sales fall under VAT (21%) instead and are outside this tax.
Zakon o porezu na promet nepokretnosti, čl. 9-11. Base is assessed market value; buyer pays.
The method
Turnover ≈ Revenue ÷ rate
Before 2024, a flat 3% makes this a clean division. From 2024 the progressive 3-6% scale needs a modelled divisor. Either way it only works with a reliable revenue figure - which is the piece Montenegro does not publish nationally.
Why it can't be completed
The Ministry of Finance's own 2025 report puts state transfer-tax collection at €15.8M in 2024 and €7.6M in 2025 - a collection figure, not a clean turnover base, and it does not reconcile with other published numbers. Since about 80% of the tax is municipal, a true national total exists only in the 25 municipal year-end budgets. So none is used here.
Ministry of Finance, Izvještaj o radu za 2025 (March 2026), Table 3.
The one number that does check out
At municipal grain, one figure is verifiable: the town of Tivat booked €786,086 of transfer tax in the first quarter of 2022. At the flat 3% rate that implies roughly €26M of resale value in Tivat that quarter alone - a clean worked example of the method. Scaling that to a national total is exactly the step the missing revenue data will not support, so the honest output is the method, not a headline number.
Straight answers on Montenegro property prices
The questions buyers and search engines ask most, answered from the official figures on this page. Every number is new-build unless noted.
How much does property cost in Montenegro?
The average price of a newly built dwelling was €2,200/m² in 2025, €2,445/m² in the first quarter of 2026 (final) and €2,557/m² in the second quarter of 2026 (preliminary), per MONSTAT. This is new-build stock sold for the first time, not resale.
Which region of Montenegro is the most expensive?
The Coastal region leads at €2,412/m² (2025), ahead of Podgorica at €2,127, the Northern region at €1,533 and the Central region at €1,202. These are MONSTAT's four reporting areas; there is no official per-municipality or per-project price.
How fast are Montenegro property prices rising?
The national new-build average rose 19.3% in 2025 versus 2024 (€2,200/m², up from €1,844). Across 2006 to 2025 the series roughly doubled.
What are new apartment prices in Podgorica?
New-build dwellings in Podgorica averaged €2,127/m² in 2025, €2,395/m² in the first quarter of 2026 (final) and €2,510/m² in the second quarter of 2026 (preliminary), per MONSTAT.
What is the property transfer tax in Montenegro?
The buyer pays it on second-hand property. It was a flat 3% from 2014 to 2023. From 1 January 2024 it is progressive: 3% up to €150,000, 5% on the €150,000-€500,000 band, and 6% above €500,000. New-build first sales are subject to VAT instead and are exempt from this tax.
Is there an official Montenegro house price index?
No. MONSTAT publishes the average price per m² of new dwellings, not a quality-adjusted index, and there is no base year. Any "Montenegro house price index" on third-party sites is derived from this same MONSTAT new-build series.
Where does this data come from, and how current is it?
Prices, construction and permits are from MONSTAT (Statistical Office of Montenegro); housing credit is from the Central Bank of Montenegro. This page was last updated on 23 August 2026, with data through the second quarter of 2026.
What each number is, and what it is not
Verified means checked against the primary source. Derived means computed from a verified figure. Stated means reported by a body but not independently re-derived here.
The price series is new-build only
MONSTAT's "Prices of dwellings in new residential buildings" measures the average selling price of dwellings sold on the market for the first time, computed from concluded purchase contracts. It excludes resale and existing stock entirely. It is an average price, not a quality-adjusted index, so a rise can reflect a shift in what was sold, not only price growth.
There is no official house price index
MONSTAT publishes absolute EUR/m² prices with no base year and no index. The index seen on third-party sites is derived from this same new-build series.
Geography stops at four areas
Podgorica, Coastal, Central and Northern. Coastal is Bar, Budva, Herceg Novi, Kotor, Tivat and Ulcinj; Central is Cetinje, Danilovgrad, Nikšić, Tuzi and Zeta; Northern is the thirteen inland municipalities. There is no municipal or per-project price.
The cadastre publishes no market report
Montenegro's Real Estate Administration is administrative: cadastre, e-services, licensing. It does not publish transaction counts, turnover or municipal average prices. A price register was announced in 2019 but no public product exists.
Activity is supply, and national only
Completed dwellings and value of works come from a business-company survey with no regional breakdown. 2024 and 2025 are preliminary and several dwelling counts carry MONSTAT's low-precision flag. The 2023 completed-dwellings figure (1,557) is final; 2024 is 1,676 preliminary.
Permits break in 2018
Permit counts drop sharply from 2017 to 2018 because of a source and definition change, so pre-2018 and later years are not one continuous series. First-half 2025 was anomalously low, then activity jumped in the second half.
Credit is lender-side
CBCG reports loan balances, new lending and interest rates, not what share of property transactions used a loan. The rate shown is CBCG's construction and housing adaptation purpose bucket.
Turnover is a method, not a measurement
The transfer-tax approach (revenue divided by rate) is only as good as the revenue figure, and Montenegro does not publish a reliable national one. The Ministry of Finance's 2025 report shows state collection of €15.8M in 2024 and €7.6M in 2025 - collection-level figures that do not reconcile. About 80% of the tax is municipal, so a true total sits only in the 25 municipal budgets. No national turnover total is asserted. The one verifiable point is Tivat's €786,086 in Q1 2022 (about €26M of resale value at 3%).
Sources
- MONSTAT, Prices of dwellings in new residential buildings - annual database 2006-2025 and quarterly releases to Q2 2026
- MONSTAT, 2025 annual release (final), Q1 2026 release (final) and Q2 2026 release (preliminary, published 20 August 2026)
- MONSTAT, construction activity database (completed dwellings, value of works) 2006-2025
- MONSTAT, Statistical Yearbook 2025 (building permits, T14-6) and Q1 2026 permits release
- CBCG, bank interest-rate statistics, Jun 2026, and household-credit data (Aug 2026)
- Zakon o porezu na promet nepokretnosti (Sl. list CG 36/2013, 28/2023)
- Ministry of Finance, Izvještaj o radu za 2025 (March 2026), Table 3 - transfer-tax collection (€15.8M 2024, €7.6M 2025)
- MONSTAT, 2025 annual price release (PDF)
- MONSTAT, Q2 2026 price release (PDF, latest quarter)
Built from official statistics. Prices are averages of new-build first sales and describe the typical new dwelling, not any specific project. They are not a valuation of any property. Data read from the sources above on 23 August 2026.
Explore further
Belgrade market data
RGZ transaction prices by area, per complex, plus contracts and turnover.
Read moreLatest market signals
Permits, policy shifts and demand moves as they happen.
Read moreResale purchase tax calculator
Work out the progressive transfer tax on a second-hand purchase.
Read moreWhere to buy in Montenegro
How the coastal, central and northern markets actually differ.
Read more